
Context
In Quebec, more than a third of the energy consumed is used to supply residential, commercial and institutional buildings, mainly for heating. Although residential heating is increasingly powered by electricity, fuel oil and natural gas still account for about 15% of the energy consumed. For institutions and businesses, the share of fossil fuels represents more than 40% of the energy supply. Consequently, the heating of buildings in the residential, commercial and institutional sectors (excluding the industrial sector) represents the third source of greenhouse gas (GHGs) emissions in Quebec, with 7.6 Mt eq. CO2 or 9.5% of emissions. In large cities of the province, these sectors are responsible for an even greater share of the GHGs produced. Across the agglomeration of Montreal, 33% of the community's GHGs come from the residential, commercial and institutional sectors.
Thus, renovating and insulating buildings appear to be an essential avenue for achieving the ambitious target of reducing Québec's GHG emissions by 37.5% below the 1990 level by 2030. One of the most promising courses of action is the energy efficiency of buildings, which would make it possible to reduce at source and optimize energy consumption. Priority 20 of the 2013-2020 action plan on climate change in Quebec was "to promote renewable energies and energy efficiency in residential, commercial and institutional buildings" (free translation). The consultation document on the 2030 GHG Emissions Reduction Target also identifies the energy efficiency of new and existing buildings as important prospects for reducing GHGs.
However, it has been shown that one of the main obstacles to energy efficiency is the lack of information owners have on the insulation of their building as well as on the products and services available.
At the same time, heat islands are a topical issue in Laval and have environmental, social and economic consequences. For several years, the Conseil régional de l’environnement (CRE) of Laval has been trying to combat this phenomenon through several projects, particularly with its study on the urban and peri-urban biotopes of the CMM and its participation in the Eco-responsible parking approach.
As part of the Thermography project, the team is therefore tackling two important issues; the fight against heat islands and the energy efficiency of buildings.
Urban heat and cool islands in Laval
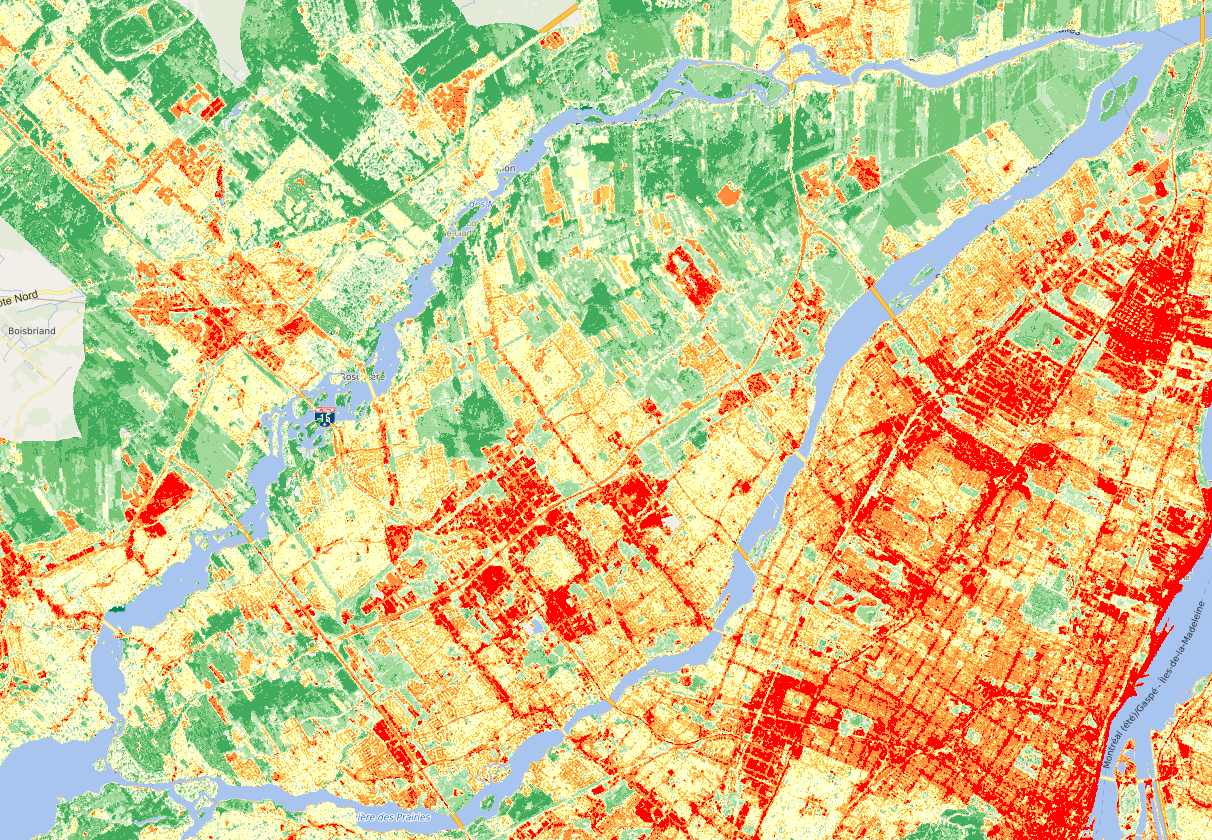
Source : INSPQ & CREFO via Données Québec, 2016
About aerial thermography
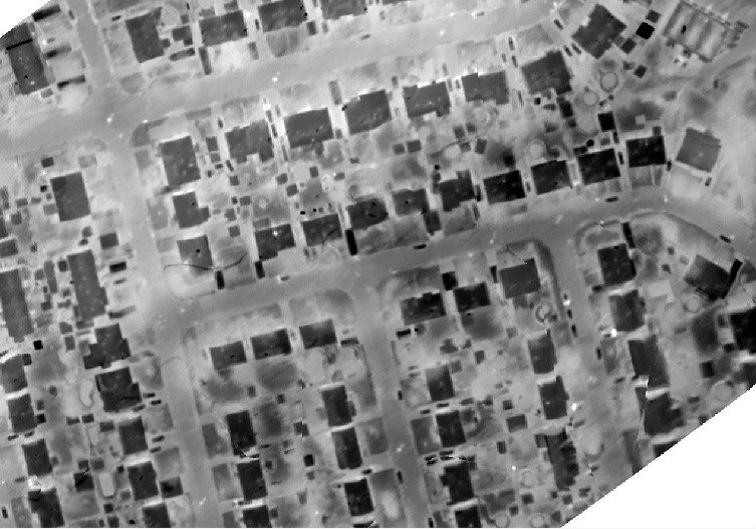
Aerial thermography is a proven technology for mapping energy losses in buildings. It is carried out using planes equipped with infrared cameras that detect heat loss from the roofs of buildings in areas overflown at low altitude. About 30% of heat loss passes through the roofs of buildings, making it the primary source of heat loss and an excellent indicator of the overall quality of a building's insulation. Aerial thermography has the advantage of quickly covering large areas.
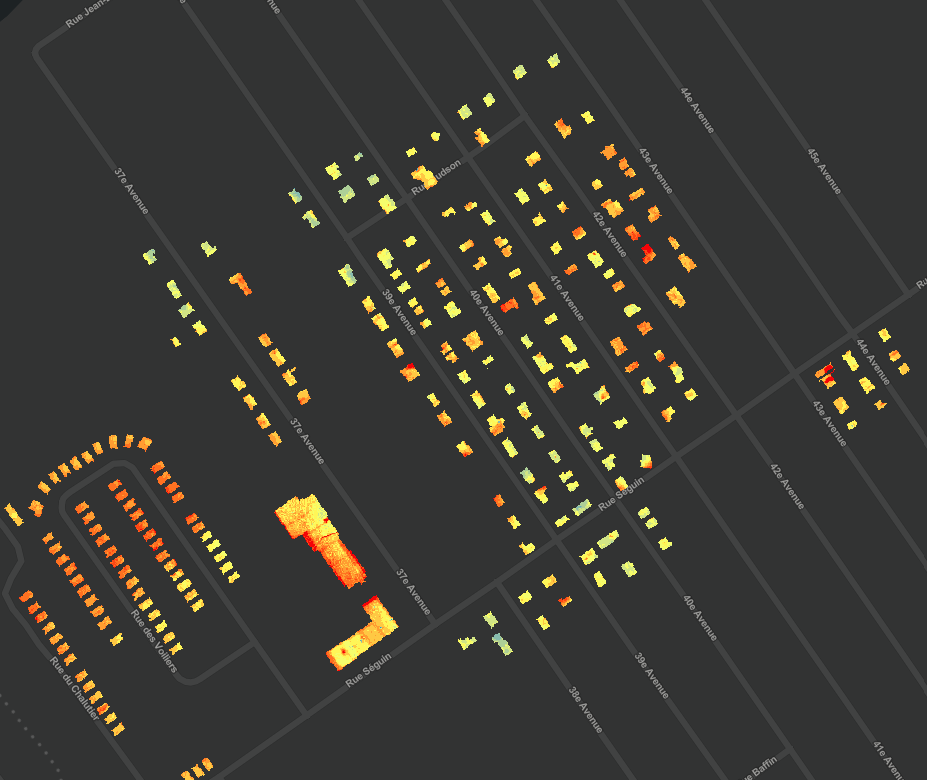
Aerial image showing the heat loss of buildings through their roofs.
Source : CRE de Laval & UQAM, 2020
Thermography elsewhere
Several cities in Quebec, such as Plessisville and Montreal, have already used thermography to map the energy losses of buildings on their territory, just like other large cities in the world such as Calgary, Paris, Bordeaux and Brussels.
Our project
Goal
We wish to offer tools and information in order to encourage the population to invest in improving the energy performance of buildings.
The objective of the project is therefore to draw a portrait of the energy performance of buildings in the entire urbanized area of the city of Laval using high-resolution aerial thermography, making it possible to identify priority intervention sectors in energy efficiency.
Method
The images were collected using an aerial platform (plane, helicopter) and a thermal camera. The flights were carried out in the fall under specific circumstances, per example, when temperatures drop below zero, at night in order to minimize the effects of thermal inertia and ideally at least 48 hours after the last precipitation. The images obtained were then processed in a photogrammetry software, PIX4D Mapper, to create thermal orthomosaics which were then superimposed on the mapping of the footprint of the buildings in order to thermally characterize each of the buildings and thus know the portions presenting an energy loss. For more technical details, you will soon be able to consult Ian Gagnon's report.
Team and organization
The project is overseen by Conseil regional de l’environnement of Laval (CRE de Laval) in partnership with the geography department of the University of Quebec at Montreal (UQAM).
Students and authors of the reports: Jade Beaulieu and Ian Gagnon Renaud
The CRE is very grateful to have received financial support from the Quebec Ministry of Municipal Affairs and Housing, as well as the collaboration and constant support of the City of Laval.
Lexicon
Heat loss
The Larousse defines this phenomenon as a "loss of heat from a room or a building to the outside or from a room to unheated rooms" (Larousse, 2019. Free translation).
Energetic efficiency
Energy efficiency occurs when the same amount of energy yields more production of goods and services, or vice versa, when less energy is used to produce the same goods and services. Responsible energy consumption not only results in higher energy efficiency, but also reduces GHG emissions and minimizes the irreversible effects of climate change (Abu Bakar et al., 2015; Patterson, 1996).
Infrared thermography
“Thermography makes it possible to determine, from a distance and without contact, the temperature of an object” (Henriot and Molines, 2017. Free translation). The infrared scanner makes visible the heat transfer, i.e. radiation or radiative flux, from the surface in the infrared spectrum (Lefebvre, 2008).
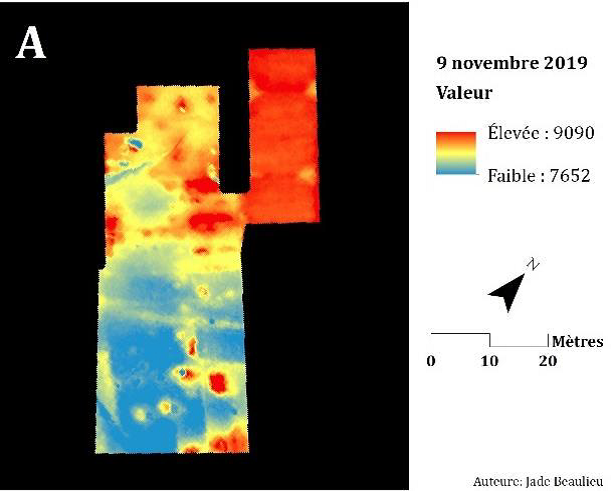
Example of a thermal image. Fabreville water treatment plant.
Thermal inertia
“The capacity of a material or matter to absorb heat energy, to store it and to restore it. Thermal inertia attenuates or delays the effects of a change in outdoor temperature on the indoor temperature of a building » (Office québécois de la langue française, 2021. Free translation).
Orthomosaic
An orthophotograph or orthoimage “is a detailed and precise photographic representation of an area, created from numerous photos that have been assembled and geometrically corrected so that it is as precise as a map » (Dukowitz, 2017. Free translation).
Progress of the project
The project started on August 1, 2018. During the planning phase, the team developed the database and processed the satellite images and completed a literature review. A series of test flights were also carried out by the aviation company responsible for acquiring the thermal aerial images.
The first flights were scheduled for fall 2018. However, given the successive rain episodes as well as the early arrival of snow, it was impossible to acquire viable data.
As a result, the team did not process the data, but took this time to perfect the method of data analysis, among other things, as well as several other tests run from spring to fall 2019.
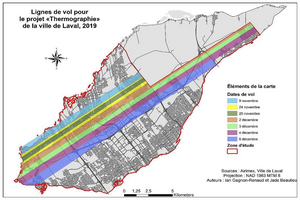
The first wave of flights was accomplished between November 9 and December 6, 2019. The airborne data captured was processed during the following months. These are discussed in two research reports, entitled Thermography Project - Thermal Loss of Roofs in Laval, by Jade Beaulieu, and Thermography Project – Method of Data Collection by Aerial Thermal Survey, by Ian Gagnon-Renaud.
The following figure illustrates the territory covered at this time, which represents 87 km2.
.png)
Conclusions from this report
Buildings from the commercial and service sectors tend to lose more heat than roofs from other types of use.
These same buildings present significantly more temperature differences, hot and cold spots, which creates significant thermal variation.
Buildings constructed between 1961 and 1990 conserve energy at roof level better than those constructed more recently between 1991 and 2010.
In particular, between 2001 and 2005, but also until 2010, the buildings of this decade present the greatest temperature variations on their roofs.
Almost half (43%) of buildings constructed before 1960 are classified as having high heat loss.
In November and December 2020, southern Laval was covered by helicopter. This represents an additional 21km2 covered.
The use of drones could have turned out to be an interesting solution, but it was ruled out considering the size of the territory to be covered and the associated logistics.

Territory covered by helicopter.
The students analyzed the data collected during the second flight session in early 2021 and incorporated it into the website.
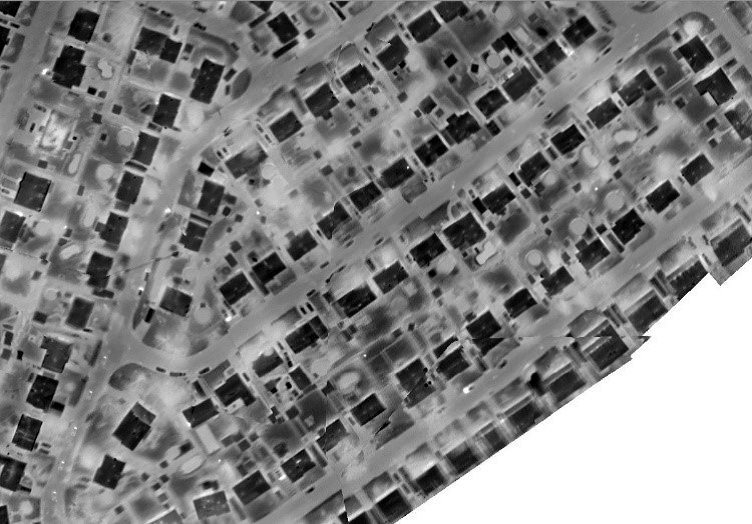
Examples of thermal images of satisfactory quality.
Results
The team concluded that the data analyzed, from distinct areas of Laval, is very comparable. That is to say that the 5 observations listed above, as well as those discussed in Ms. Beaulieu's report, apply as much to the sector overflown in 2019 as to the one overflown in 2020. This allows us to estimate that this sample (56%) is representative of the rest of the territory of Île Jésus.
We would like to underline the excellent collaboration of the City of Laval (Mr. Patrick Saumure, Mr. Hung Nguyen and Mr. François Paquette).
The Thermography project in numbers
Square kilometres flown: 98 out of the 175 of Île Jésus.
Number of flights exclusively for data collection: 9
Number of images captured: 38,304 (first wave of flights only)
Research grants: 2 graduate students for 2 1/2 years full-time and 1 undergraduate student for 1 year part-time
What can I do?
Individuals
- Conduct a thermographic analysis of your building carried out by a specialized company. There are several in Quebec. Images should be obtained and interpreted by experts certified by the American society for nondestructive testing (ASNT).
- Look after your building to extend the life of its components.
- Smartly renovate your building. There are financial incentives to support you in your green renovation (see below).
- On a smaller scale, manage energy use intelligently, for example by consuming less and better. In winter, consider lowering the temperature a few degrees in unused rooms, equip yourself with adjustable thermostats, etc.
Companies
- Smartly renovate your building.
- Manage energy consumption (as the University of Quebec at Montreal has done)
- Obtain the Novoclimat certification from the Bureau de normalization du Quebec (for contractors and ventilation specialists).
- Have the energy efficiency of your new construction analyzed free of charge by a Novoclimat assessor (for entrepreneurs).
Regulation and support
- Establish energy performance requirements for all renovations and new construction.
- Encourage the renovation and replacement of materials and energy systems through funding programs that are accessible, recurrent and easy to use.
Programs and funding
Residential:
- Chauffez vert
- Éconologis
- Novoclimat Maison
- Novoclimat Petits bâtiments multilogements
- RénoClimat
- The Canada Mortgage and Housing Corporation (CMHC) offers a 15% discount on the insurance premium for the purchase of a Novoclimat home
- Efficient heat pumps (program supported by Hydro-Québec since February 2021)
Commercial, institutional, industrial buildings and multi-unit buildings of 4 floors or more:
More information (in French)